


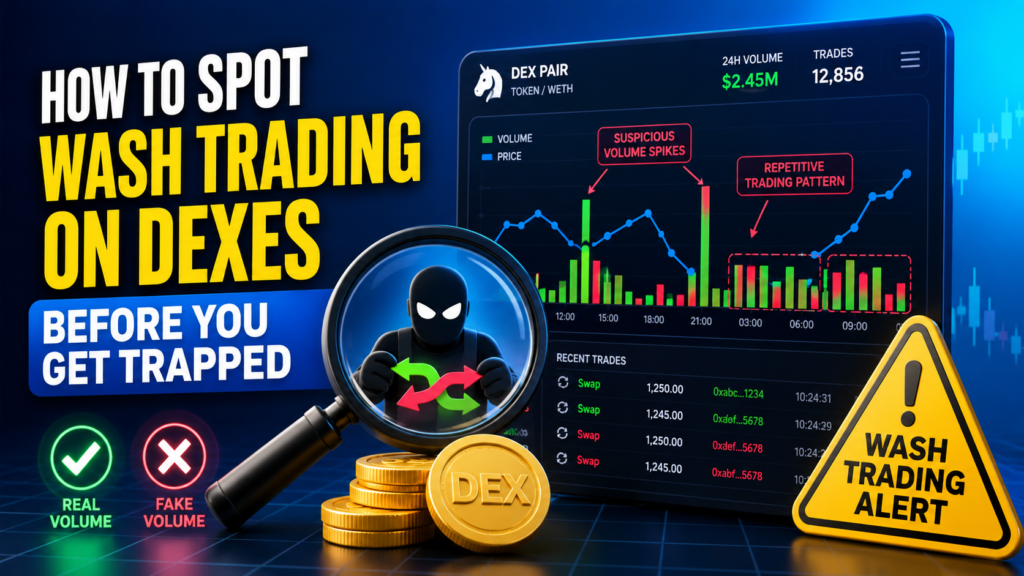
The decentralized finance (DeFi) landscape moves at breakneck speed. With decentralized exchanges (DEXes) on chains like Solana, Base, and Ethereum handling billions of dollars in daily transactions, the opportunity for rapid gains is undeniable. However, this permissionless environment also provides a playground for bad actors.
One of the most pervasive traps awaiting retail investors today is DEX wash trading. Unlike centralized exchanges that implement strict anti-manipulation checks, DEXes allow anyone to interact directly with smart contracts anonymously. This lack of friction has made wash trading the go-to weapon for malicious developers looking to manufacture hype out of thin air.
If you rely solely on standard tracking platforms to find trending tokens, you are likely looking at fabricated metrics. This guide will break down exactly how DEX wash trading works and equip you with the on-chain data skills needed to spot these traps before risking your capital.
What is DEX Wash Trading?
At its core, wash trading is a form of market manipulation where an individual or a coordinated group simultaneously buys and sells the same asset. Because the buyer and the seller are ultimately the same entity, no actual market risk is taken, and there is no true change in the beneficial ownership of the tokens.
On a decentralized exchange, bad actors use wash trading primarily to accomplish two deceptive goals:
- Volumetric Inflation: To trick algorithms on data aggregators (like DEX Screener, DEXTools, or Birdeye) into pushing their token onto the “Trending” or “Top Gainers” list.
- Artificial Price Inflation (LPI): To create clean, upward-trending green candles on price charts, making the asset look highly appealing to retail investors scrolling through social media.
Once unsuspecting traders notice the massive volume and “ape” into the token, the deployer dumps their supply onto the artificial liquidity, leaving the community with worthless tokens, a classic rug pull. In fact, recent on-chain studies show that over 60% of tokens subjected to rug pulls or pump-and-dump schemes utilize wash trading as their primary setup stage.
The Two Faces of DEX Manipulation
On-chain forensic data categorizes DEX-based wash trading into two primary structural methodologies:
1. Same-Address Wash Trading (A-A Trades)
This is the crudest form of manipulation. A single cryptocurrency wallet address serves as both the buyer and the seller. The wallet acts as a dominant liquidity provider to a pool while simultaneously executing rapid token swaps back and forth against itself.
2. Multi-Party Network Wash Trading
As retail tools grow more sophisticated, manipulators have adapted by using collusive wallet networks. Instead of trading with a single account, the deployer splits funds across 10, 20, or even 50 seemingly unrelated wallets. These wallets execute an intricate web of circular transactions, passing tokens and native gas assets (like SOL or ETH) around in a loop to obscure the unified entity pulling the strings.
  Multi-Party Wash Loop
   ┌───────────────┐
   │ Master Wallet │ (Provides Initial Gas)
   └───────┬───────┘
           │
   ┌───────▼───────┐      Swaps Token      ┌───────────────┐
   │   Wallet A    ├──────────────────────►│   Wallet B    │
   └───────▲───────┘                       └───────┬───────┘
           │                                       │
           │             Swaps Token               │
           └───────────────────────────────────────▼
On-Chain Blueprint: How to Spot the Fakes
To avoid getting trapped in a fabricated market, you must look directly at the blockchain ledger using block explorers or visual security tools. Run every potential trade through this diagnostic framework:
1. The Trader-to-Trade Ratio
When examining a healthy token on a platform like DEX Screener, you should see a diverse, distributed ecosystem of unique buyers and sellers.
- The Formula: Check the total number of TXs (Transactions) relative to the total number of unique traders over a 24-hour window.
- The Red Flag: If a token claims to have $5 million in daily trading volume with 4,000 total transactions, but only 150 unique active wallets, the volume is entirely manufactured. A high ratio of trades per trader indicates that a small, automated script is endlessly cycling orders.
2. Hunting for the Common Funder
The ultimate smoking gun of a multi-party wash trading network is a shared financial origin. Open the transaction ledger on a blockchain explorer (like Etherscan or Solscan) and trace the history of the top trading addresses.
- Look Backwards: Click on three or four wallets that are actively making identical, rapid trades. Go to their oldest transaction history.
- The Discovery: In a wash network, you will frequently find that all of these trading wallets were funded with gas money by a single common external funder wallet right before the token pool was launched.
3. Circular Volume and Identical Trade Sizes
Genuine human trading is chaotic, emotional, and uneven. People buy and sell random amounts of crypto based on their individual net worth or risk tolerance.
- The Red Flag: If the raw transaction feed shows block after block of perfectly mirrored trades such as Wallet A buying exactly 1.45 ETH of a token, followed seconds later by Wallet B selling exactly 1.45 ETH of the token you are looking at a programmed script. This zero-risk position loop keeps the network’s internal balance perfectly flat while pumping the volume metrics sky-high.
Leverage Visual Cluster Tools to Protect Yourself
Manually clicking through dozens of wallet addresses on a block explorer can be incredibly time-consuming, especially when seconds matter. Fortunately, the 2026 Web3 analytics ecosystem has birthed highly specialized data visualization tools that expose these manipulation structures instantly.
Platforms like Bubblemaps map token ecosystems visually using interactive bubbles to represent individual wallets.
   Healthy Token Ecosystem               Wash Traded Cluster
     (Disconnected Bubbles)             (Heavy In-Network Linking)
         ○      ○                          ○ ─── ○ ─── ○
      ○    ○      ○                         │           │
         ○      ○                          ○ ─── ● ─── ○
                                            (Master Wallet)
When you load a token contract on Bubblemaps, look for the structural connection lines:
- In a natural market, the bubbles are largely independent and floating freely, representing disconnected retail market participants.
- In a wash network, the tool will reveal a massive, heavily linked cluster where dozens of bubbles are connected by bright lines. This visual web shows you exactly how the developer’s wallets are passing funds to one another to fabricate activity.
Quick Reference: Natural vs. Fabricated Markets
| Data Metric | Healthy Token Profile | Wash Traded Token Profile |
| Unique Wallets | High, growing naturally alongside total volume metrics. | Very low relative to the massive displayed transaction volume. |
| Funding History | Wallets funded from diverse sources (CEX withdrawals, bridges). | Wallets funded sequentially by the same master deployer address. |
| Order Book Patterns | Scattered, irregular buying and selling patterns. | Perfectly symmetrical, repeating buy/sell amounts down to the decimal. |
| Social Sentiment | Organic community chatter across X, Discord, and Telegram. | Dead chat channels filled with bot accounts, completely misaligned with the “booming” DEX volume. |
Final Thoughts
DEX wash trading relies entirely on your psychological fear of missing out (FOMO). By designing clean charts and artificial volume spikes, manipulators count on you buying into their asset blindly.
The next time you see an explosive new token leading the trending tabs, don’t rush into a swap. Take two minutes to check the unique wallet count, glance at the transaction log for perfectly identical trade sizes, and run the address through a visualization tool. If the metrics feel artificial, keep your capital safely in your wallet. The blockchain ledger never lies—you just have to know how to read it.